Instructions and tutorials

1. Update the app

2. Change parameters

3. Making connection between Power BI desktop and your dataset

4. Adding Excel file from SharePoint to the local data model

5. Adding Excel file from Google Sheets to the local data model

6. Specific measures

7. Customization

8. Enabling API calls in Smart Accounts

9. Adding budget (type: account, granularity: year)

1. Update the app

 When a new version of the app becomes available, you will see a notification in your workspace:

Get it now > Install

You have the option to update your current workspace and app, or alternatively, create a new workspace to preserve the older version.

Note 1.

If you decide to update the existing workspace and the app, the workspace name will automatically be changed to the app’s name with current date. However, you can go to the workspace settings and manually rename it. Please do not use “/” or other special characters in the name, it might cause connection problems later.

Note 2.

If you are using local data model it is essential to reconnect to updated dataset. Open Power BI desktop and navigate to transform data, select Data source settings.

From there select change source, find your dataset and select all the tables, then submit and close.

If you wish to modify your parameters (such as API ID, start period, etc.), navigate to your workspace. Locate the three dots next to your dataset, click on them, and select ‘Settings’. In the ‘Parameters’ section, you can make the desired changes.

3. Making connection between Power BI desktop and your dataset

Open Power BI desktop. Select Get data > Power Bi datasets.
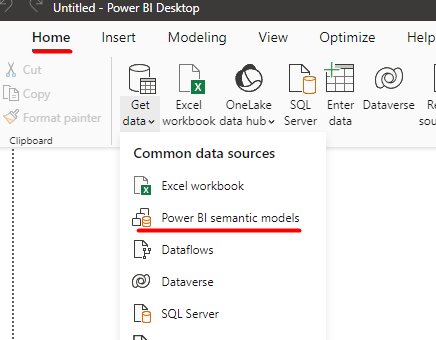
 Find your dataset and click connect . 
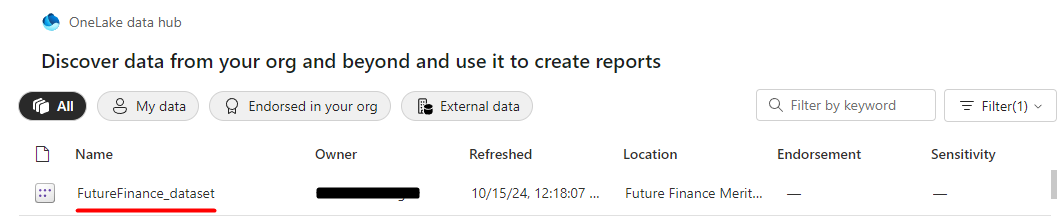
If you would like to add additional sources to the dataset (like excel file), then click in the bottom right corner on the:

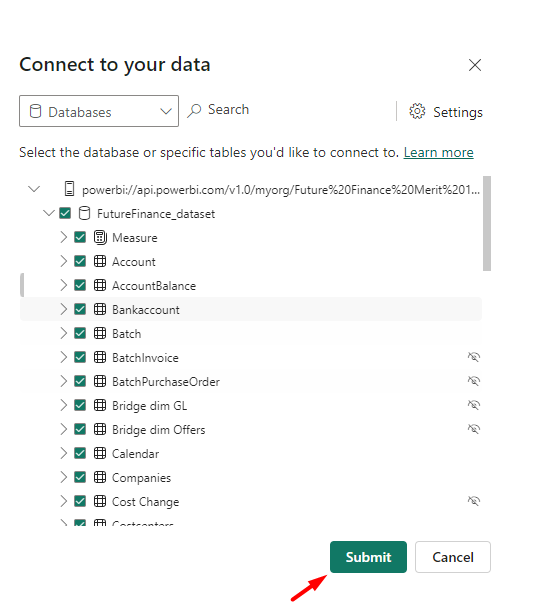
Add a local model > submit.

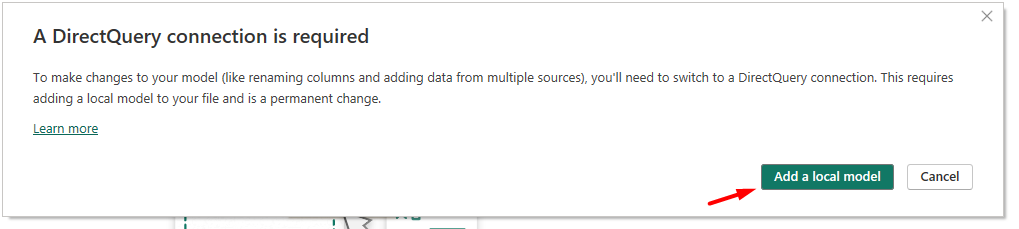
Now you can start working on your report.

Once your created report is complete, click on ‘Publish’. Save the file and choose the workspace where you intend to publish the report. 
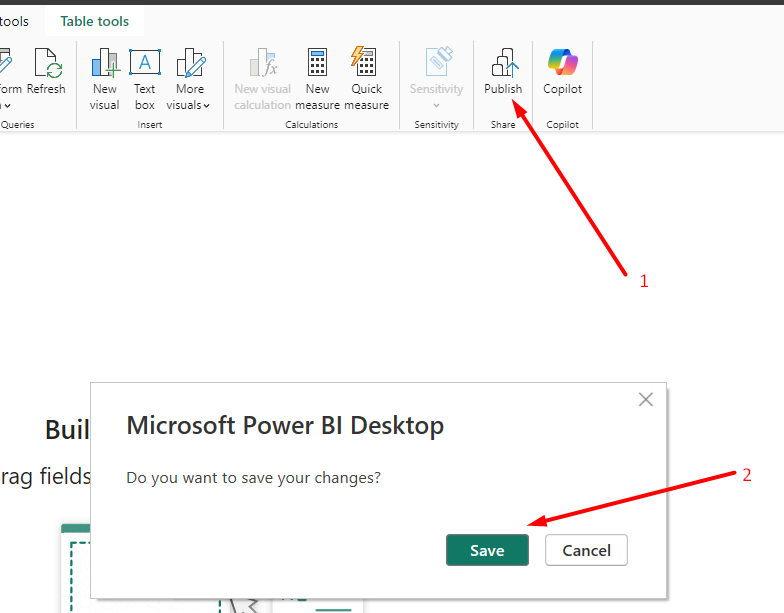
Now, in your workspace, you can add the report to your app by toggling the ‘Included in app’ switch.
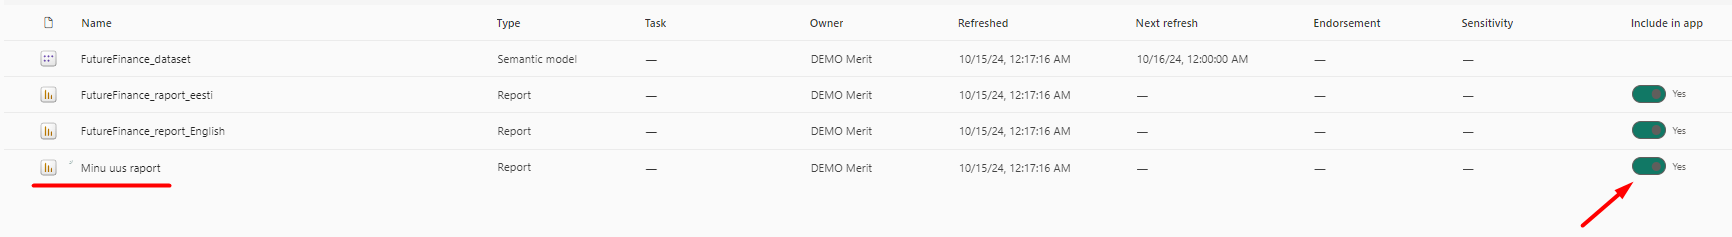
4. Adding Excel file from SharePoint to the local data model

4.1 Straight from SharePoint

Go to your SharePoint page:

        There are folders in Documents pane

        Locate the Excel file

        Click the three dots ellipsis button

        Click Details

In the Details pane, scroll down in the pane to find the Path section

Click the Copy Direct Link button


In Power BI Desktop, click Get Data, then select Web and paste the link in the URL text box.

Note 3. After making changes in excel file (changing the file location, changing columns etc.) you need to check connections again with the model to make sure everything still works.


4.2 From Teams


From Teams in General Channel select Files tab and Open in SharePoint.

From SharePoint copy the URL to the level of the site.

Example:
https://yourcompany.sharepoint.com/sites/yoursitename

In power BI desktop select
– Get data
– SharePoint folder and paste your URL
– select Transform Data
– Find the file you would like to add to Power Bi and next to that file in the Content column click on Binary
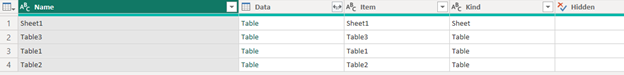
– select which data you would like to load to the dataset by clicking on Table in Data column

– If your data is not formatted as a table in Excel, then click on the Use first row as a Headers on the top pane

– Close and apply

5. Adding Excel file from Google Sheets to the local data model

  • Connecting Power BI Desktop to Google sheets
  • Open Power BI desktop
  • Select Get data > More.. 
  • Write Google Sheets to the search box and connect (it might give you a warning, press continue)
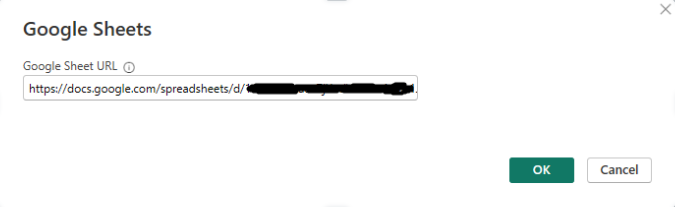
  • In the URL box paste the file URL that you want to add to Power BI (open the file in the Google Sheets and copy the URL) and press OK. 


  • Sign in to your Google account and connect
  • Select sheets/tables you want to add and select Transform data.
  • If your data is not formatted as a table in Excel, then click on the Use first row as a Headers on the top pane
  • Close and apply

6. Specific measures

While using the measure [Transaction balance by dateselection] you also need to add Datecalculationlogic to the report page.

7. Customization

If you like to use your custom chart of accounts, you shall make an excel file and store it preferably in your SharePoint. Connect the file with local data model (see headline 4) and create connection between your chart of accounts and our accounts table (account ID and your table account code field). Your account code field should be text field.

8. Enabling API calls in SmartAccounts

In SmartAccounts all the API calls that we use in our dataset are not enabled by default. In order to allow API calls, you need to take these steps:

 – Log in to your SmartAccounts account and select Settings (the ratchet in the upper right corner)

 – Select Users & groups from the left menu

 – Under user group click on API

 – Add the following rights to the user group (search and click on them so they would go to other column):

•             Settings – Report settings (for reportrows table)

•             Settings – Template settings (for documenttemplates table)

•             Payroll – Employees (for payouttypes, workers, absencetypes tables)

•             Payroll – Time off (for workerabsences table)

Save

9. Adding budget (type: account, granularity: year)

Your excel file should contain following columns:
Account ID, Year, Budget value

  • Load the table into power bi (from SharePoint, google sheets, or other supported cloud source)
  • Add your excel file to the Power BI dataset: Get data> SharePoint, Google Sheets or etc. (where your excel file is located)
  • Transform data and select your excel file sheets
  • Optionally: In Power Query you can see if the column headers are correct if not you can click on “Use first row as Headers“
  • Close and Apply


    Connecting tables into model
  • Go to model view
  • By pressing plus sign on the bottom, you can make a new layout
  • Add a relationship from Account ID to Account ID
  • Here the table is named “Fact Budget”, and the relationship is on Account ID. If the column names and column types are identical, power bi creates the relationship automatically
  • Adding the relationships
    • Fact Budget- Account (via Account ID)
    • Fact Budget – Calendar (via year)


et